Thermoforming can look simple from the outside: heat a plastic sheet, shape it over a mold, then cool and trim it. On the production floor, energy moves through every stage. Ceramic heaters cycle above the sheet, vacuum pumps pull air through the mold, and cooling systems work to keep parts consistent. When a line runs between orders, those systems may keep drawing power even when useful production has stopped. Small losses add up.
Learning how to optimize energy consumption in thermoforming starts with understanding where energy goes, not guessing which machine uses the most. Metering equipment, reviewing utility bills, and tracking production data can help identify patterns. A warmer-than-needed oven zone or a leaking compressed-air line may seem minor, yet both can run for hours. The right response depends on the machine, material, product design, and operating schedule. There is no single setting that fits every plant.
This guide explores seven practical ways to reduce avoidable energy use, from tuning heater zones and improving insulation to limiting idle time and maintaining equipment. Each change should be tested against part quality, cycle time, and scrap levels. A lower energy reading is not a win if it produces warped parts or more waste. Some improvements are less obvious than expected. Results also take time to verify, and not every measure pays back quickly. Careful measurement, informed adjustments, and honest review make the savings more dependable.
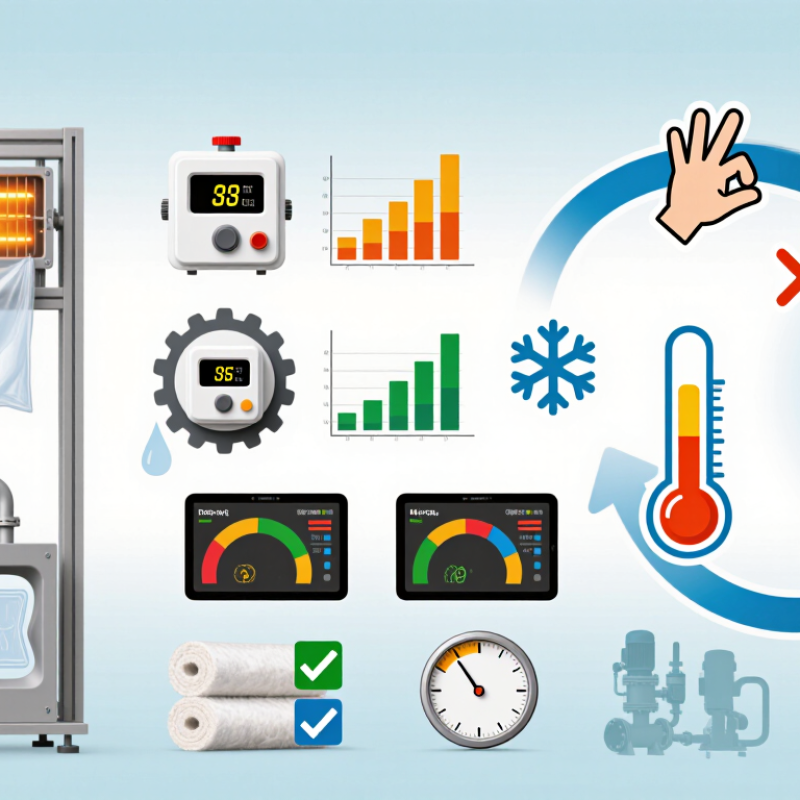
A useful thermoforming energy target starts with a dependable baseline, not a guess from last month’s utility bill. Track kilowatt-hours per kilogram of good product across a representative period, ideally covering different shifts and product runs. The DOE Better Plants 25%-in-10-year goal is an energy-intensity benchmark, not a promise that every line can reduce consumption at the same pace.
Define the measurement boundary and keep it fixed. Include the energy used by heaters, extruders, chillers, and vacuum pumps, where meters allow. Record good output weight, scrap, sheet thickness, machine hours, and product mix beside each reading. A line making thin trays may use energy differently from one forming thick parts. That matters. Compare like with like, and note unusual shutdowns or maintenance days rather than quietly deleting them. A simple spreadsheet can help, but it can also conceal gaps in meter coverage. Review the numbers with operators who know when ovens idle between runs or cooling systems keep working during breaks. Then use the baseline to test practical changes, such as tighter start-up routines or reduced idle time. Recheck the same kWh/kg measure after each change; one month of improvement is encouraging, but not proof of a lasting gain.
Establish a comparable baseline before evaluating savings. Calculate energy intensity as metered energy (kWh) divided by good product output (kg) for the same time period. Track product mix, operating hours, and production conditions alongside the result. The U.S. Department of Energy’s Better Plants program sets a 25% energy-intensity improvement goal over 10 years for participating organizations; it is a program goal, not a thermoforming-specific benchmark.
| Optimization opportunity | Practical action | Energy-use mechanism | Metric to track | Measurement notes |
|---|---|---|---|---|
| 1. Establish a kWh/kg baseline | Meter the thermoforming line or its major loads, and record good output over the same period. | A consistent energy-intensity measure makes changes in consumption visible relative to production. | kWh/kg of good product; total kWh; kg produced | Use the same meter boundaries and time period. Separate or document product mix, start-ups, downtime, and unusual operating conditions. |
| 2. Tune heater zones and recipes | Review zone setpoints, warm-up procedures, and heating time with process and quality teams; verify temperatures rather than relying only on controller displays. | Heating plastic sheet is a major process energy demand. Avoiding excessive temperatures and unnecessary heating time can reduce energy use while maintaining forming quality. | Heater kWh per run; warm-up kWh; scrap rate; cycle time | Change settings methodically and confirm part quality, material specifications, and safe operating limits. |
| 3. Reduce idle and start-up energy | Coordinate production scheduling, use approved standby settings during planned stops, and shut down equipment when it is safe and practical to do so. | Heaters and auxiliary equipment can consume energy while a line is waiting, warming up, or between runs. | Idle kWh; start-up kWh; scheduled versus actual run time | Log stops by cause and duration. Include restart time and quality checks when assessing shutdown or standby practices. |
| 4. Maintain vacuum and compressed-air systems | Repair leaks, maintain filters and regulators, inspect hoses and connections, and verify that vacuum or air settings match process requirements. | Leaks and unnecessarily high pressure or vacuum demand can increase compressor and pump operating time or power use. | Compressor and vacuum-pump kWh; pressure or vacuum level; leak findings | Measure pressure or vacuum at the point of use under operating conditions, and document repairs and follow-up checks. |
| 5. Optimize cooling and chilled-water operation | Inspect heat exchangers and filters, maintain water flow, check for fouling, and review chilled-water setpoints with equipment and process requirements in mind. | Poor heat transfer or unnecessary cooling demand can increase chiller and pump energy. | Chiller and pump kWh; supply and return temperatures; flow; alarms | Compare readings during similar production conditions. Do not raise setpoints beyond process or equipment limits. |
| 6. Improve yield and reduce scrap | Track scrap by cause, stabilize forming conditions, and prevent defects that require reheating or rerunning material. | Energy used on rejected product does not contribute to good output, increasing kWh per kg of saleable product. | Good kg; scrap kg; first-pass yield; kWh/kg of good product | Define scrap consistently and distinguish in-process scrap from trim or material sent for recycling. |
| 7. Review insulation and preventive maintenance | Inspect accessible heated surfaces, guards, seals, electrical connections, motors, and drive components; repair defects according to safety procedures. | Damaged insulation and poorly maintained components can contribute to avoidable heat loss or inefficient operation. | Maintenance findings; equipment kWh; temperature or operating alarms | Use qualified personnel for inspections and repairs. Compare energy readings before and after maintenance under similar production conditions. |
Track kilowatt-hours per kilogram of good product over representative shifts and product runs. Record output weight, scrap, machine hours, and product mix. One month alone may not tell the whole story.
It is a benchmark for reducing energy intensity over ten years, not a guaranteed pace for every line. Compare your own results over time.
Include heaters, extruders, chillers, and vacuum pumps when meters allow. Keep the boundary consistent. Missing meters can skew the picture.
Thin trays may use energy differently from thick parts. Compare similar thicknesses, product mixes, and operating conditions to avoid misleading results.
Note unusual shutdowns, maintenance days, changeovers, and idle periods. Operators may know when ovens sit between runs or cooling systems keep running during breaks.
Measure its operating load, current, run time, and production rate during typical cycles. A low load may suggest oversizing, but check peak demand and start-up torque before changing equipment.
It may help when flow or pressure needs change. It will not save energy automatically on every machine. Measure first.
Recheck kWh per kilogram after the change and monitor scrap, quality, vacuum recovery, and cycle time. A short trial on one line can reveal problems. Not proof yet.
Learning how to optimize energy consumption in thermoforming begins with establishing a clear kWh-per-kilogram baseline. Compare current performance with a long-term improvement target, then review energy use regularly to identify where savings are possible. During production pauses, reduce oven standby loads and track heater electricity use per production hour. This helps reveal whether heating systems are consuming energy without creating value.
Next, ensure motors and drives are appropriately sized for their workloads, since motors account for a substantial share of manufacturing electricity use. Inspect compressed-air systems and repair leaks, which can waste an estimated 20–30% of supplied air. Finally, verify that changes deliver measurable results by monitoring kWh per kilogram over time, using consistent production data and energy-performance tracking. Together, these steps can reduce waste, improve process efficiency, and support lasting energy savings.

 Switara Packing